
Overview
Using Waveforms’ Oscilloscope or Spectrum Analyzer instruments to acquire the typical FM radio frequencies is just one of the capabilities of the Analog Discovery Pro 5250 (ADP5250) analog input channels, which have up to a 1 GS/s sample rate for capturing data. Using a sample that has a frequency at least 4 times larger than the highest frequency component in the captured spectrum will allow you to demo this yourself.
You can also emit a frequency-modulated audio signal using an FM modulator, which can be analyzed by an ADP5250 in real time. This type of FFT analysis requires resolution bandwidth.
Inventory
- Analog Discovery Pro 5250 (ADP5250)with:
- WaveForms Installation, version 3.15.18 or later
- Car FM modulator – optional, for measurements only
- A preconfigured WaveForms workspace which can be used for this demo is available for download: dwf3work.zip
Demo Setup
Hardware Setup
To measure FM frequencies using the ADP5250 in this demo, you need to use a 1GHz in a single oscilloscope mode. Connect the device and select this mode in the lower right corner of WaveForms. You can view the input modes and available devices in WaveForms’ Device Manager.


If you are using a simple cable instead of a BNC antenna to capture FM frequencies, use the formula below to determine the wire length:
Antenna length: L= N ⋅ λ/2 (where N is a constant for a short wire; N=1 as default)
For this demo, a wire with a length of 110 cm (43.31 inches) was used as an antenna and connected with a BNC to channel 1 of the Mixed Signal Oscilloscope section of the ADP5250.

Software Setup
The data on the oscilloscope input channels was processed using Waveforms. The instruments used in the software were the Spectrum Analyzer (Spectrum) and the Oscilloscope (Scope). To acquire and display input signals in real-time, and to demodulate the signal, use the Scope. The Spectrum can be utilized to identify and visualize the local radio stations.
You can use https://radiomap.eu/ or a similar site to check local FM stations in your area.
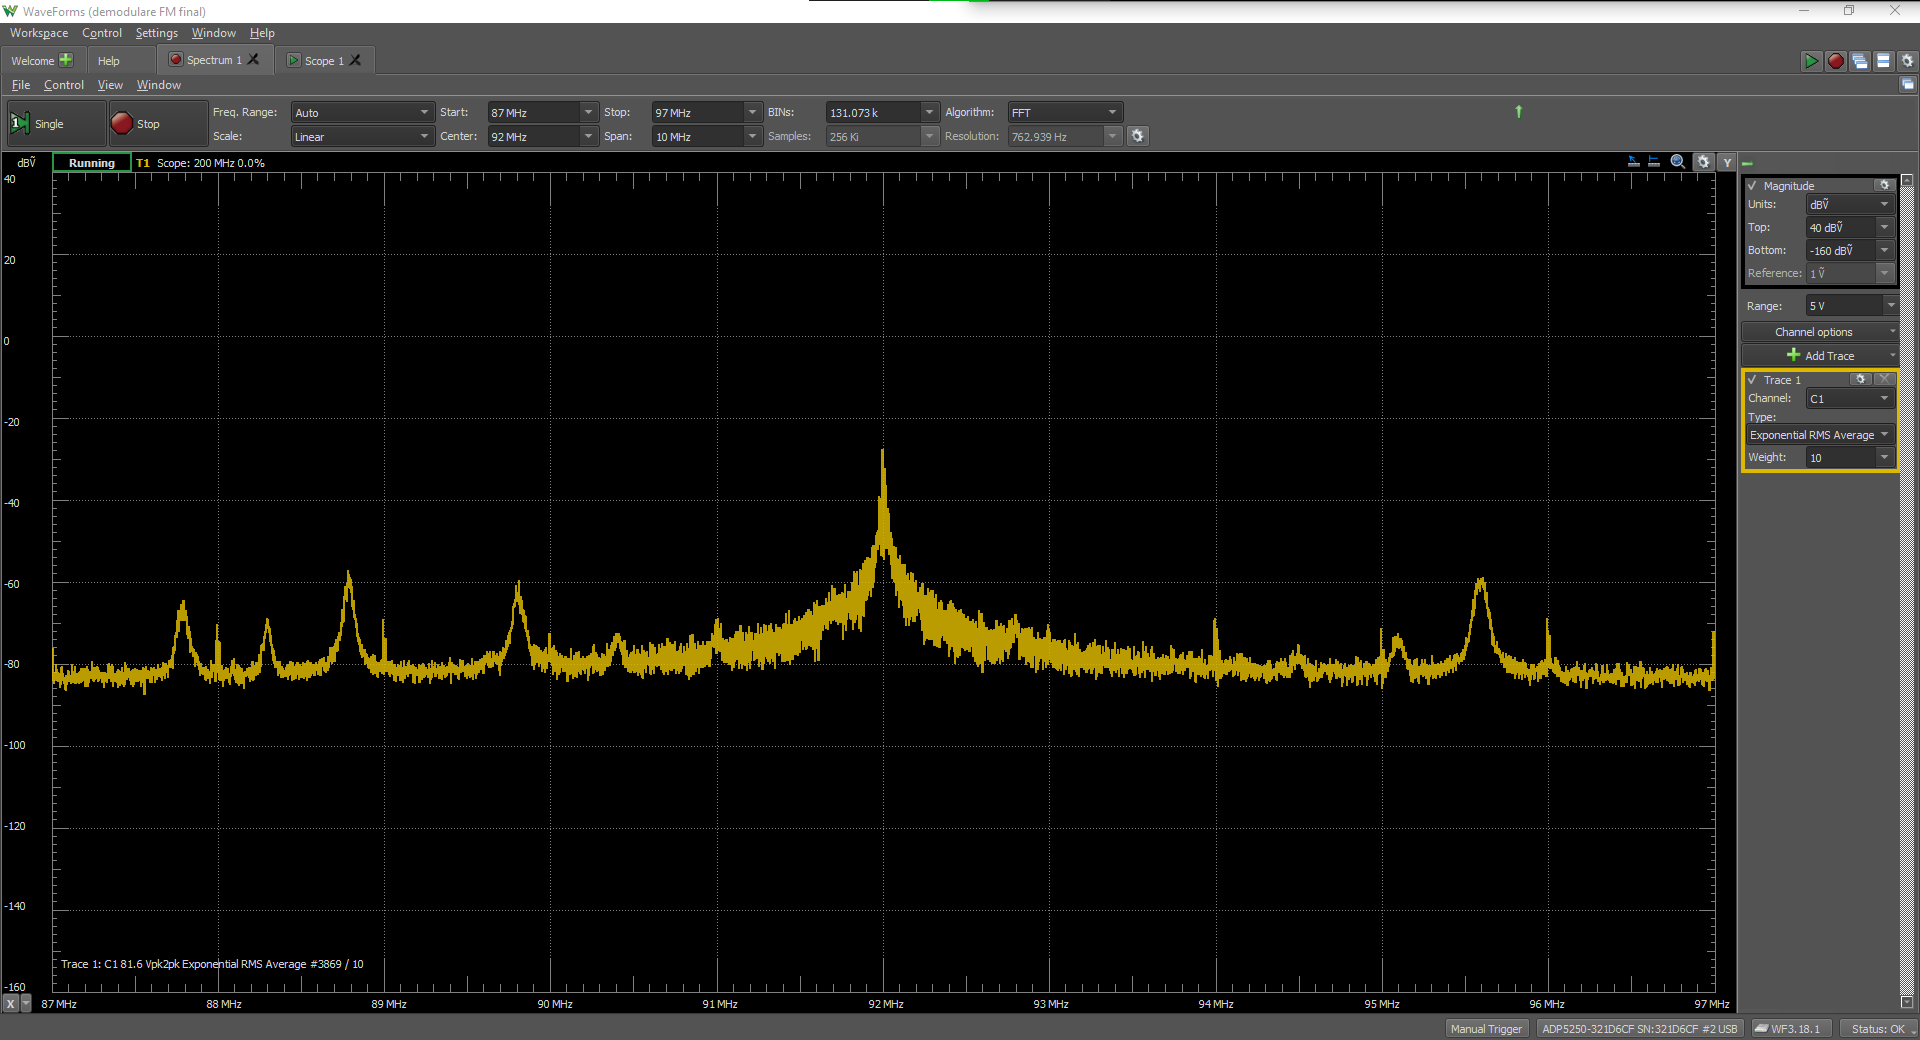
Spectrum: For a view of detected frequencies, configure the Spectrum instrument using the following settings:
- Start: 87 MHz
- Stop: 110 MHz
- BINs: 262.145k
- Algorithm: FFT
![]()
These settings can be used to sample in real time. To reduce the noise, use BINs:65.537k to decrease the resolution and number of acquisitions; this helps to see fewer points in sample mode.
For the input channel, the following parameters were set, in addition to setting the frequency range. Note that if using a wire antenna, set attenuation at 10x.


The channels captured with ADP5250 are shown on the graph below, while the radio stations available in the local area can be seen on the list. In ours, you will see some of the radio stations available in Cluj-Napoca, which is where our demo was made.
An FM modulator may be necessary if the detection of local FM frequencies is not allowed in your physical location. The modulator is set at a 93MHz frequency. The modulator’s physical position near the antenna allows for a clearer view of the emitted signals, compared to other FM signals.


Using the Scope to View the Frequency Spectrum and Recover Time-Domain Signals
You can use the Scope instrument to capture what the antenna wire detected from its surroundings in real time, as we did in this demo. Noises emitted from both the radio stations and the surrounding electronic devices were detected by the antenna. You can see these parasitic frequencies on the Spectrum plot. Using the Spectrum tools, you can set the start and stop frequency range, or view the spectrum range specified by zooming out.

In this part of the demo, you can demodulate the reception signal to view the audio signal from a radio station by using one of the mathematical channels offered in WaveForms called LockIn. You can access LockIn in the drop menu under Add Channel to the right of the plot. To demodulate the signal, first you need to choose the carrier frequency, which is limited to 100 MHz in WaveForms. Next you must set the maximum frequencies allowed to pass. In our demo, a low-pass filter with a cut-off frequency of 20kHz was set.
The Math channel has the following settings:
- Input: C1
- Reference: Internal
- Frequency: user-specified frequency
- Filter: Butterworth
- Order: 4
- Type: Low-pass
- Freq1: 20 kHz
- Gain: 10X or 1X depending on the antenna type
- Output: Real


The Scope plot displays the audio captured by the antenna. The results may differ depending on the antenna and surrounding noise. Audio files can also be played through the FM modulator and displayed on the Scope plot.

Other Resources
For more guides and example projects for your Analog Discovery Pro (ADP5250), please visit its Resource Center.
For technical support, please visit the Digilent Forums.